import matplotlib.pyplot as plt # To make visualisations
from sklearn.cluster import KMeans #To perform K-Means clustering
from sklearn.cluster import DBSCAN
from sklearn.datasets import make_blobs #To generate data for kmeans
from sklearn.datasets import make_moons #To generate data for DBSCAN
X, y = make_blobs(n_samples=300, centers=4, cluster_std=0.9, random_state=42)X.shape #Collection of points in 2D space(300, 2)X_coord = X[:, 0] #X coordinates of the points
Y_coord = X[:, 1] #Y coordinates of the points
print(X_coord[:5])
print(Y_coord[:5])[ -9.25175257 -9.61269979 -1.7689072 -7.07554027 -10.67263984]
[ 6.55866298 6.97742293 7.91552684 -5.89121043 6.41624524]plt.scatter(X_coord, Y_coord, s=50, c='blue');
kmeans = KMeans(n_clusters=4, n_init='auto') #N_init refers to the number of times the clustering algo is ran
kmeans.fit(X)
y_pred = kmeans.predict(X)
y_pred
array([1, 1, 3, 2, 1, 2, 0, 2, 3, 0, 3, 0, 3, 3, 1, 3, 1, 0, 3, 3, 0, 3,
2, 1, 3, 1, 1, 2, 2, 0, 3, 0, 1, 0, 1, 3, 1, 2, 1, 2, 0, 3, 1, 2,
3, 3, 1, 0, 1, 0, 2, 1, 2, 3, 2, 0, 1, 0, 0, 3, 1, 0, 0, 1, 2, 2,
2, 2, 2, 3, 2, 2, 1, 0, 3, 1, 2, 2, 3, 2, 3, 3, 1, 3, 2, 1, 1, 0,
0, 0, 1, 3, 1, 3, 3, 1, 2, 3, 1, 1, 0, 0, 0, 3, 3, 3, 3, 3, 2, 1,
0, 3, 3, 3, 3, 0, 1, 2, 1, 2, 2, 2, 3, 1, 2, 1, 1, 3, 1, 2, 0, 3,
3, 3, 3, 0, 0, 1, 3, 2, 3, 0, 2, 3, 0, 0, 0, 0, 2, 3, 3, 1, 0, 2,
3, 0, 2, 1, 1, 0, 3, 1, 2, 1, 0, 1, 2, 3, 3, 3, 3, 3, 2, 0, 0, 2,
2, 0, 0, 2, 1, 3, 1, 0, 0, 1, 2, 3, 0, 0, 2, 2, 2, 1, 0, 2, 2, 0,
0, 1, 3, 3, 2, 0, 3, 2, 2, 1, 2, 3, 3, 2, 2, 0, 1, 2, 1, 1, 3, 1,
1, 2, 1, 2, 0, 0, 1, 1, 0, 0, 0, 1, 3, 2, 0, 2, 1, 0, 1, 1, 1, 2,
2, 0, 1, 2, 2, 2, 1, 2, 1, 2, 1, 0, 2, 1, 0, 3, 1, 3, 0, 3, 1, 3,
2, 0, 2, 0, 0, 3, 3, 2, 0, 0, 1, 1, 2, 3, 3, 0, 0, 0, 0, 2, 1, 0,
2, 0, 0, 2, 3, 2, 0, 3, 1, 3, 0, 3, 1, 1], dtype=int32)plt.scatter(X_coord, Y_coord, s=50, c=y_pred, cmap='viridis')
centers = kmeans.cluster_centers_ # Gets the coordinates of the cluster centers
plt.scatter(centers[:, 0], centers[:, 1], c='black', s=100);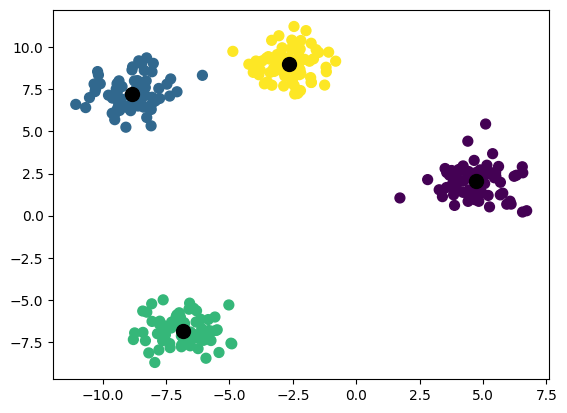
Link to a visualisation site: https://www.naftaliharris.com/blog/visualizing-k-means-clustering/
Is k-means the perfect option for all cases?
X, y = make_moons(n_samples=300, noise=0.05, random_state=42)kmeans = KMeans(n_clusters=2, n_init='auto', random_state=42)
labels = kmeans.fit_predict(X)
print(labels.shape)(300,)plt.scatter(X[:, 0], X[:, 1], c=labels, s=50, cmap='viridis');
centers = kmeans.cluster_centers_
plt.scatter(centers[:, 0], centers[:, 1], c='black', s=100);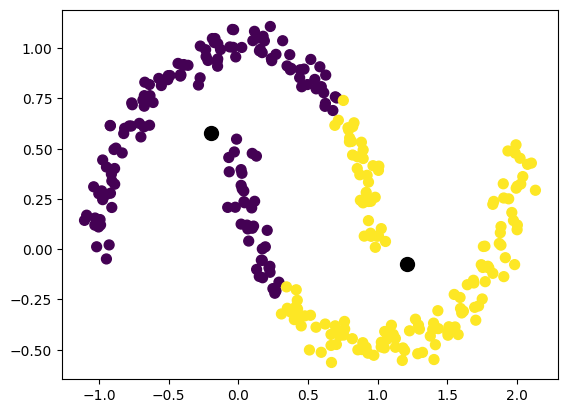
To overcome this issue we use other clustering algorithm such as DBSCAN
dbscan = DBSCAN(eps=0.3, min_samples=2).fit(X)
labels = dbscan.labels_
plt.scatter(X[:, 0], X[:, 1], c=labels, s=50, cmap='viridis');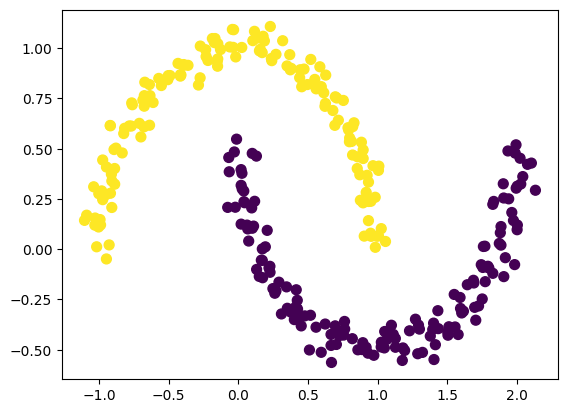
Link to a visualisation site: https://www.naftaliharris.com/blog/visualizing-dbscan-clustering/